
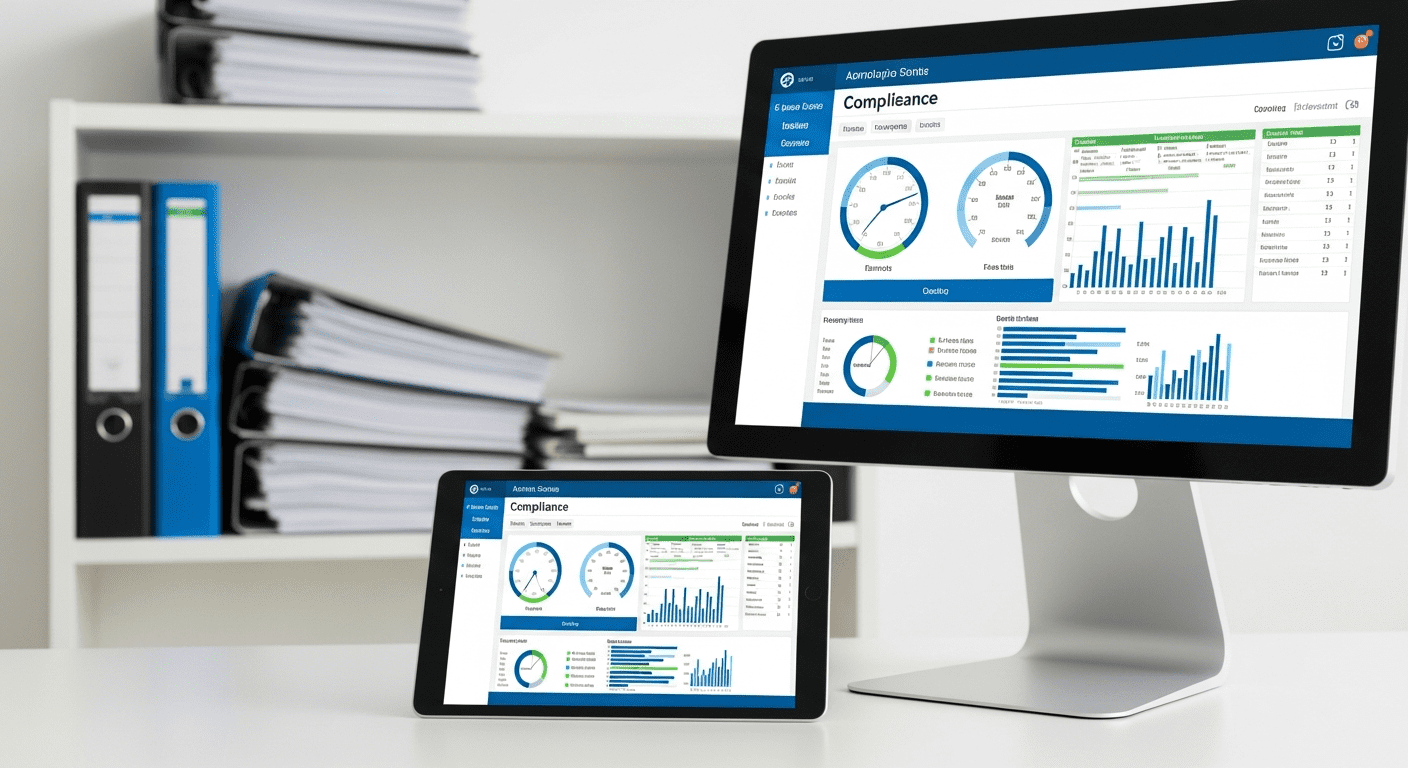
When drug and alcohol testing data reaches the board, it needs to tell a clear, concise story. Directors do not need — or want — granular details about individual test results. They need to understand whether the organisation’s testing program is functioning effectively, whether it is meeting its compliance obligations, and whether the investment is delivering measurable safety outcomes.
Yet many organisations struggle with this translation. Safety managers who are deeply familiar with the operational detail of their testing program often produce reports that are either too detailed for a board audience or too superficial to support informed governance.
This guide covers what metrics boards actually care about, how to present them, and how to connect testing data to the broader work health and safety narrative.
What the Board Needs to Know
Board members have a personal duty of due diligence under WHS legislation. They are required to take reasonable steps to understand the organisation’s safety risks and to verify that those risks are being managed. Drug and alcohol testing is one of the controls the board relies on — and they need assurance that it is working.
Board reporting should answer four questions:
- Are we testing at the frequency we committed to?
- What are the results telling us?
- Are we responding appropriately to adverse results?
- Is the program reducing our risk exposure?
Key Performance Indicators for Board Reporting
Testing Compliance Rate
This is the most fundamental metric: are we doing what we said we would do? Report the number of tests completed against the target, broken down by testing type (random, for-cause, post-incident, pre-employment). Express it as both an absolute number and a percentage of target.
If the compliance rate is below target, the report should explain why — insufficient testing provider capacity, operational disruptions, workforce changes — and what actions are being taken to address the shortfall.
Positive Rate
The percentage of tests that returned non-negative results. Present this as a current-quarter figure, a year-to-date figure, and a trend line over the past two to three years. Context matters — a 2% positive rate is meaningless without knowing whether it was 4% last year (improvement) or 1% last year (deterioration).
Substances Detected
A breakdown of which substances are being detected — cannabis, methamphetamine, cocaine, alcohol, prescription medications, and others. This information helps the board understand the nature of the risk and can inform decisions about support services, awareness campaigns, and policy adjustments.
Response and Resolution
What happened after each positive result? Report on:
- Number of employees stood down pending confirmation
- Number referred to EAP
- Number entering return-to-work programs
- Number of terminations
- Number of refusals to test
This demonstrates to the board that the organisation is not just testing — it is acting on the results in accordance with its policy.
For-Cause Testing Activity
The number of for-cause tests conducted is a proxy for supervisor engagement with the program. An organisation that conducts hundreds of random tests but zero for-cause tests may have a training or culture gap. Report the number of for-cause tests, the outcomes, and any trends.
Incident Correlation
Where applicable, report on the relationship between testing and incidents. Were post-incident tests conducted for all notifiable incidents? Were any incidents linked to substance impairment? How does the incident rate compare to previous periods?
How to Present Testing Data to a Board
Keep It Visual
Boards process information quickly. A single-page dashboard with clear charts and traffic-light indicators is far more effective than a multi-page written report. Key visuals include:
- A bar chart showing testing volume by month or quarter
- A trend line for positive rates over time
- A pie chart or bar showing substance breakdown
- A traffic-light summary of key metrics (green = on target, amber = watch, red = below target)
Provide Context
Numbers without context are meaningless at the board level. Every metric should be accompanied by a brief narrative that explains what it means, whether it is on track, and what actions are being taken if it is not.
Focus on Trends, Not Snapshots
Boards are interested in direction of travel. A single quarter’s data is a data point. Three years of quarterly data is a trend. Always present data in a time-series format that allows directors to see whether the program is improving, stable, or deteriorating.
Frequency of Reporting
Quarterly reporting is the standard for most board-level safety metrics. This provides sufficient data volume for meaningful analysis while aligning with typical board meeting schedules.
In addition to regular quarterly reports, the board should receive immediate notification of:
- Any positive result involving a serious safety incident
- Any regulatory action or investigation related to workplace impairment
- Significant changes to the testing program or policy
Connecting Testing to WHS Outcomes
Testing data should not be presented in isolation. The board should see how testing contributes to the organisation’s overall safety performance. Effective connections include:
- Incident reduction. If incident rates have declined since the testing program was implemented, make the connection explicit — while acknowledging that testing is one of several contributing factors.
- Workers’ compensation impact. If substance-related claims have decreased, quantify the financial benefit in terms of reduced premiums and direct costs.
- Due diligence evidence. Frame the testing program as evidence that the organisation — and its officers — are meeting their WHS obligations. This is particularly relevant for directors who are conscious of their personal liability.
- Cultural indicators. Include qualitative information about workforce attitudes towards the program, supervisor engagement, and EAP utilisation alongside the quantitative metrics.
The Risk Reduction Narrative
Ultimately, boards think in terms of risk. Your compliance report should tell a risk story:
“Our testing program is operating at 95% of target. The positive rate has declined from 3.2% to 1.8% over the past two years. All positive results were managed in accordance with policy, with 100% of affected employees referred to EAP. The program contributes to our 18% reduction in recordable safety incidents over the same period. We recommend maintaining current testing levels and investing in additional supervisor training to improve for-cause detection.”
That paragraph gives a board everything it needs: compliance status, trend direction, process adherence, outcome correlation, and a clear recommendation.
Need to generate board-ready compliance reports in minutes, not days? Start a free trial of FairTest and turn your testing data into the clear, visual, trend-based reporting your board expects.